

How ten years of PCT publications in patent class H01M chart the rise of China in the global battery race
Few technologies have risen up the global patent agenda as quickly as batteries. Drawing on a decade of international (PCT) patent applications published in International Patent Classification H01M – the class covering battery technologies – we chart the extraordinary growth of the field between 2016 and 2026, and the decisive shift in who is driving it.
The headline: Filings have more than tripled
Published H01M PCT applications climbed from 4,090 in 2016-2017 to 14,004 in 2025-2026 – roughly a 3.4-fold increase, at a compound annual growth rate of about 15%. Batteries are now one of the fastest-growing corners of the entire PCT system, tracking the global surge in electric vehicles and grid-scale energy storage.
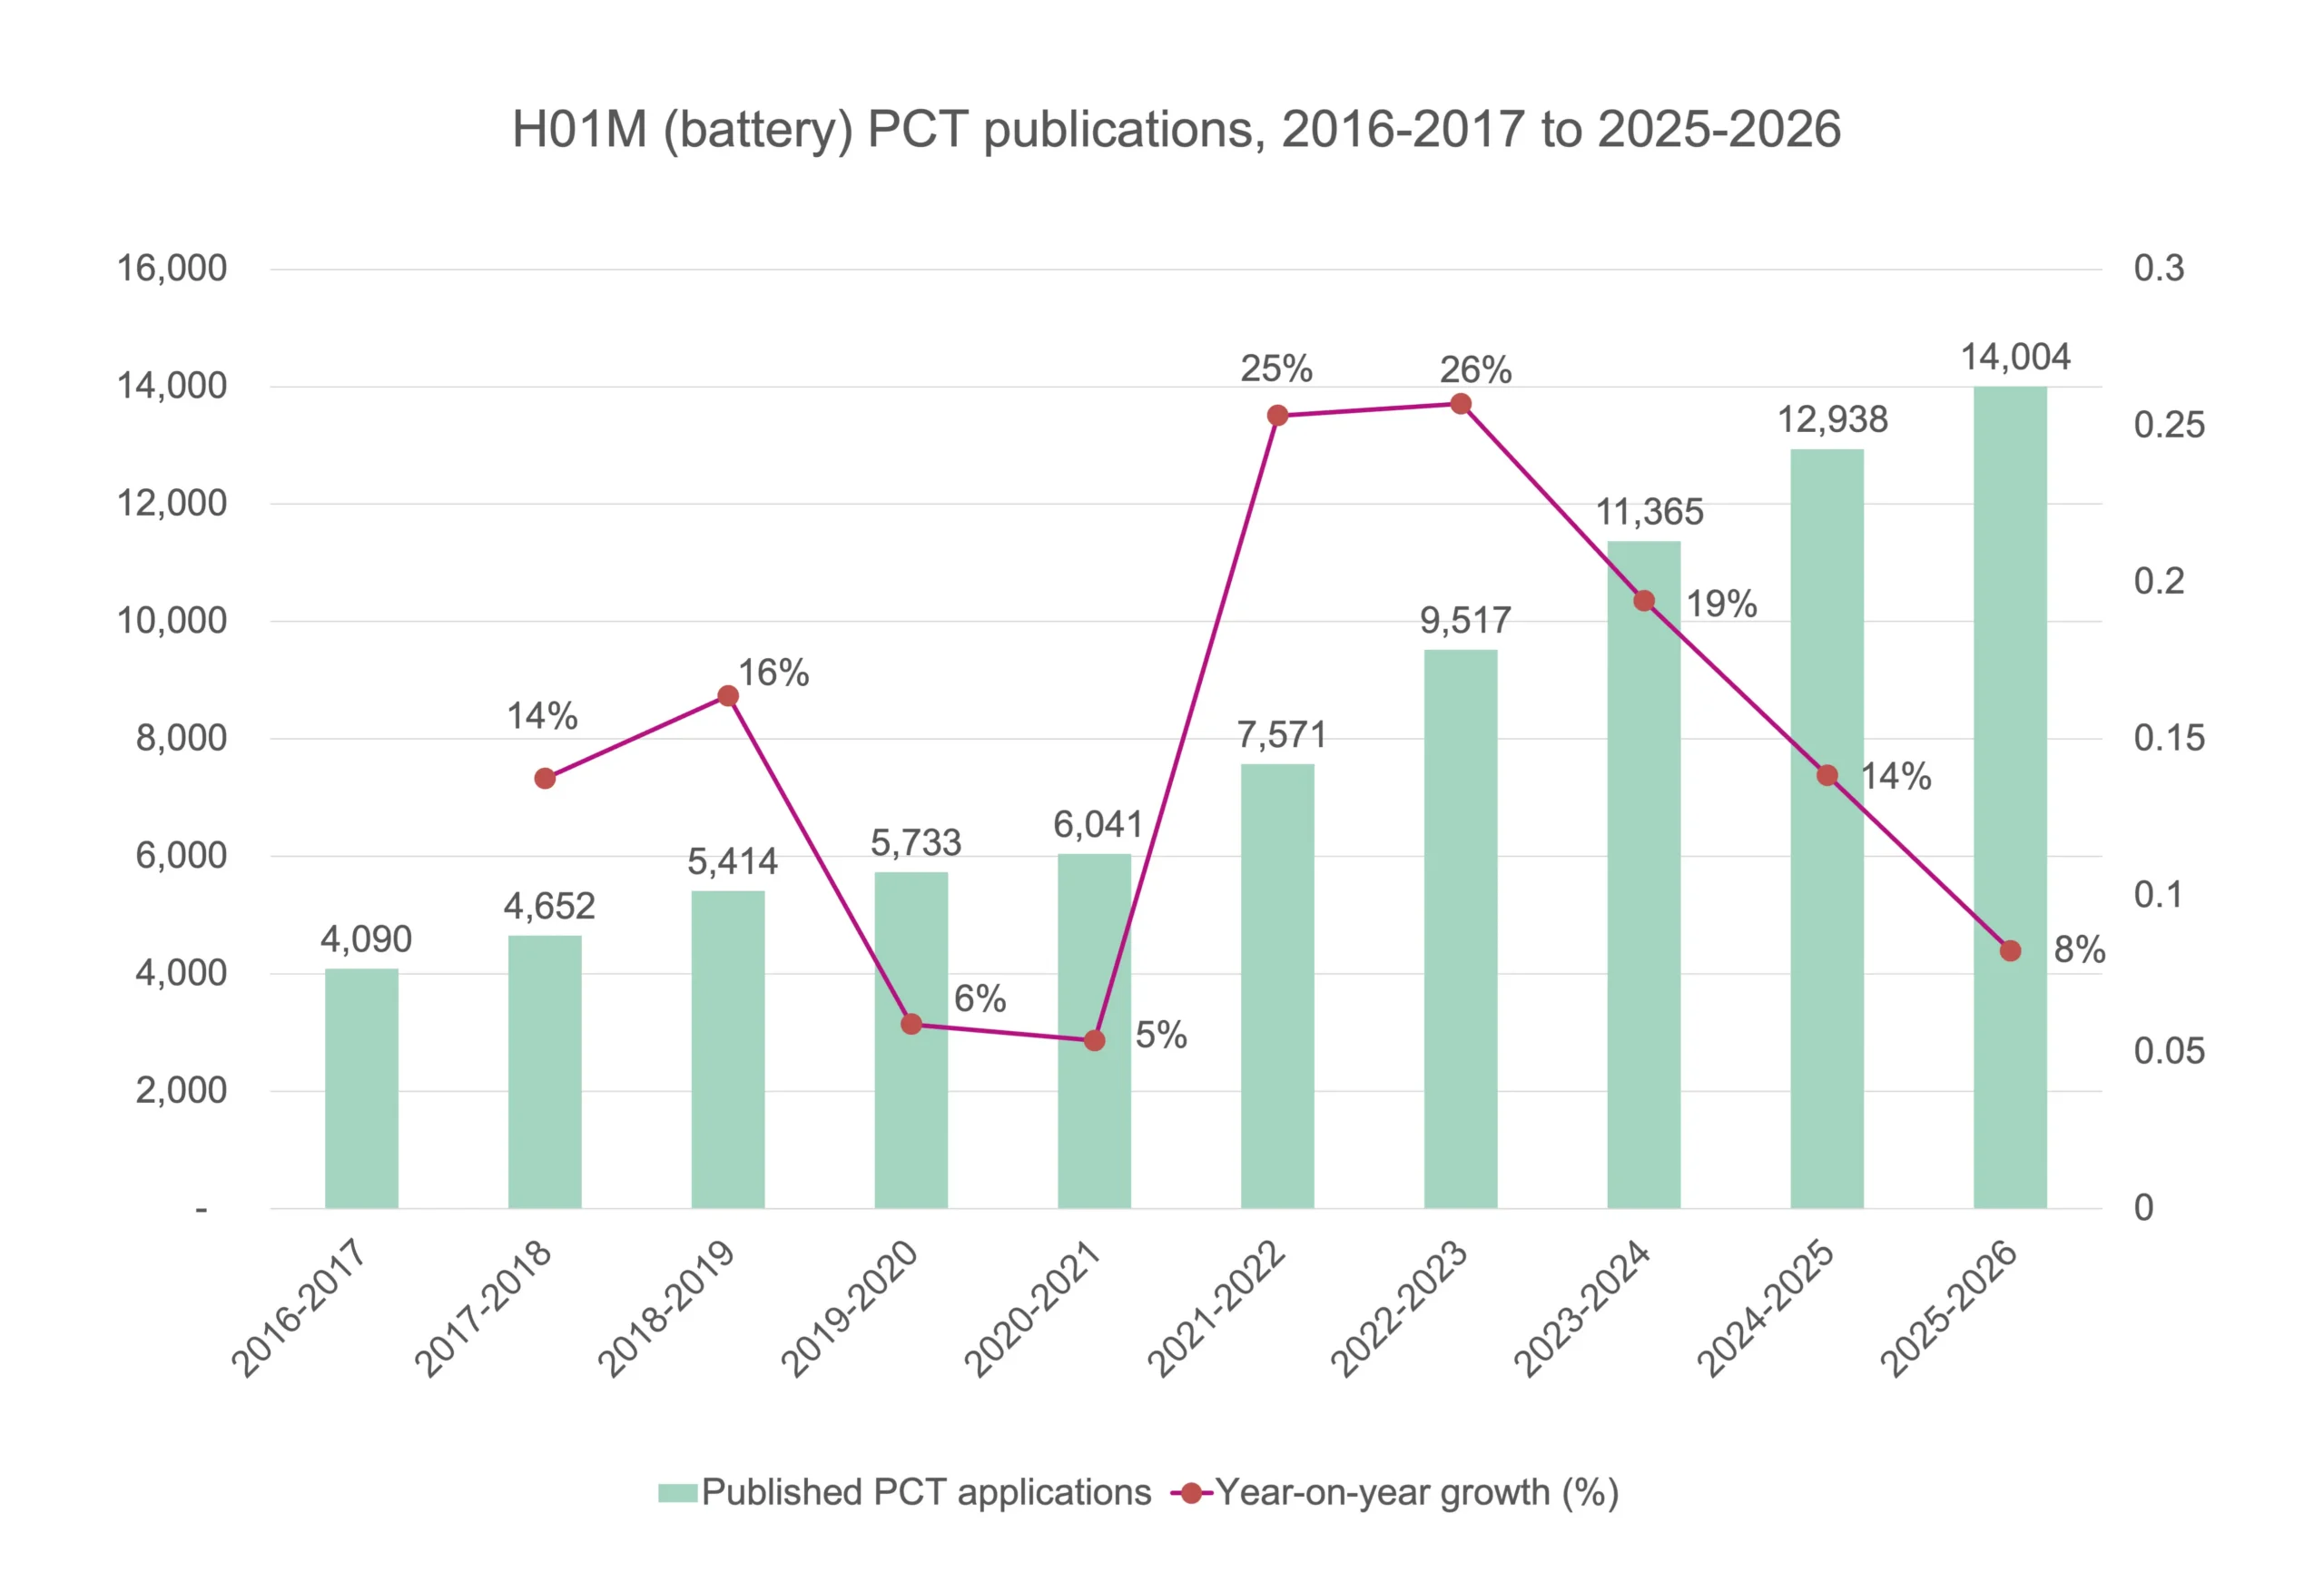
The trajectory falls into three phases: a steady climb through 2016-2020, with a visible pause around 2019-2021; an explosive surge of ~19-26% per year from 2021 to 2024; and a recent moderation to +8.2% in the latest full year. Because a PCT application publishes some 18 months after filing, published-application trends are a lagging reflection of original filing decisions taken earlier.
| Period | Published PCTs | Year-on-year change |
|---|---|---|
| 2016-2017 | 4,090 | - |
| 2017-2018 | 4,652 | +13.7% |
| 2018-2019 | 5,414 | +16.4% |
| 2019-2020 | 5,733 | +5.9% |
| 2020-2021 | 6,041 | +5.4% |
| 2021-2022 | 7,571 | +25.3% |
| 2022-2023 | 9,517 | +25.7% |
| 2023-2024 | 11,365 | +19.4% |
| 2024-2025 | 12,938 | +13.8% |
| 2025-2026 | 14,004 | +8.2% |
Table 1 – Annual H01M PCT publications and year-on-year growth.
The story beneath the numbers: a changing of the guard
The most striking finding is not simply that the field grew, but who grew. The top-20 applicants, assessed at three points in the decade, lay the shift bare – and show how top-heavy the field has become. In 2025-2026 the top two names alone (CATL and LG Energy Solution) each out-file the rest of the table many times over: third-placed Panasonic, on 542 applications, trails the leader by more than 1,400 applications.
Top-20 H01M assignees by period
| # | 2016-2017 | 2020-2021 | 2025-2026 |
|---|---|---|---|
| 1 | LG Chem 311 | LG Energy Sol. 484 | CATL 1,950 |
| 2 | Panasonic 125 | CATL 322 | LG Energy Sol. 1,822 |
| 3 | Robert Bosch 122 | Panasonic 250 | Panasonic 542 |
| 4 | Nissan 89 | LG Chem 220 | Samsung SDI 440 |
| 5 | Sumitomo Electric 77 | Sanyo 141 | BYD 393 |
| 6 | Sanyo 74 | Robert Bosch 135 | Ningde Amperex 339 |
| 7 | Toyota Industries 69 | Murata 127 | EVE Energy 293 |
| 8 | GS Yuasa 59 | GS Yuasa 120 | Nissan 173 |
| 9 | Toshiba 58 | Ningde Amperex 97 | Robert Bosch 158 |
| 10 | Hitachi Auto. 51 | Denso 60 | POSCO 155 |
| 11 | NEC 51 | Sumitomo Electric 59 | LG Chem 154 |
| 12 | Sumitomo Wiring 49 | Zeon 50 | EVE Power 148 |
| 13 | Tian Dong 46 | Samsung SDI 45 | GS Yuasa 111 |
| 14 | AutoNetworks 45 | Panasonic Hldg 42 | Sunwoda 100 |
| 15 | CEA 41 | Honda 39 | Xiamen Hithium 89 |
| 16 | Zeon 40 | BYD 37 | EVE Energy Stor. 89 |
| 17 | Murata 40 | Sumitomo Wiring 36 | BMW 79 |
| 18 | BMW 36 | Dyson 36 | SVOLT 79 |
| 19 | Audi 35 | BMW 36 | AESC 70 |
| 20 | Toray 33 | Resonac 35 | CALB 70 |
Table 2 – The full top-20 H01M assignees at three points in the decade (assignee – PCT count).
Top two in bold.
Cell shading denotes the assignee’s home country:
| China | South Korea | Japan | Germany | Other |
Read down the columns, the transformation is unmistakable. In 2016-2017 the table is almost entirely Japanese, with a lone Korean leader and a scatter of German OEMs; there is a single Chinese name (Tian Dong, 13th). By 2025-2026 the table has transformed: ten of the twenty names are now Chinese, and a Chinese company – CATL – leads outright. Korean and Japanese champions still hold three of the top four places, but the top two, CATL (1,950) and LG Energy Solution (1,822), together account for around 27% of all H01M PCT publications in this period.
The bigger picture: Applicant country of residence
Assignee league tables show the elite tier, but they can flatter or obscure a country’s true weight. To see the whole field we turn to the complete population of filings classified by the applicant’s country of residence. This confirms the China story on a far firmer footing and sharpens it.
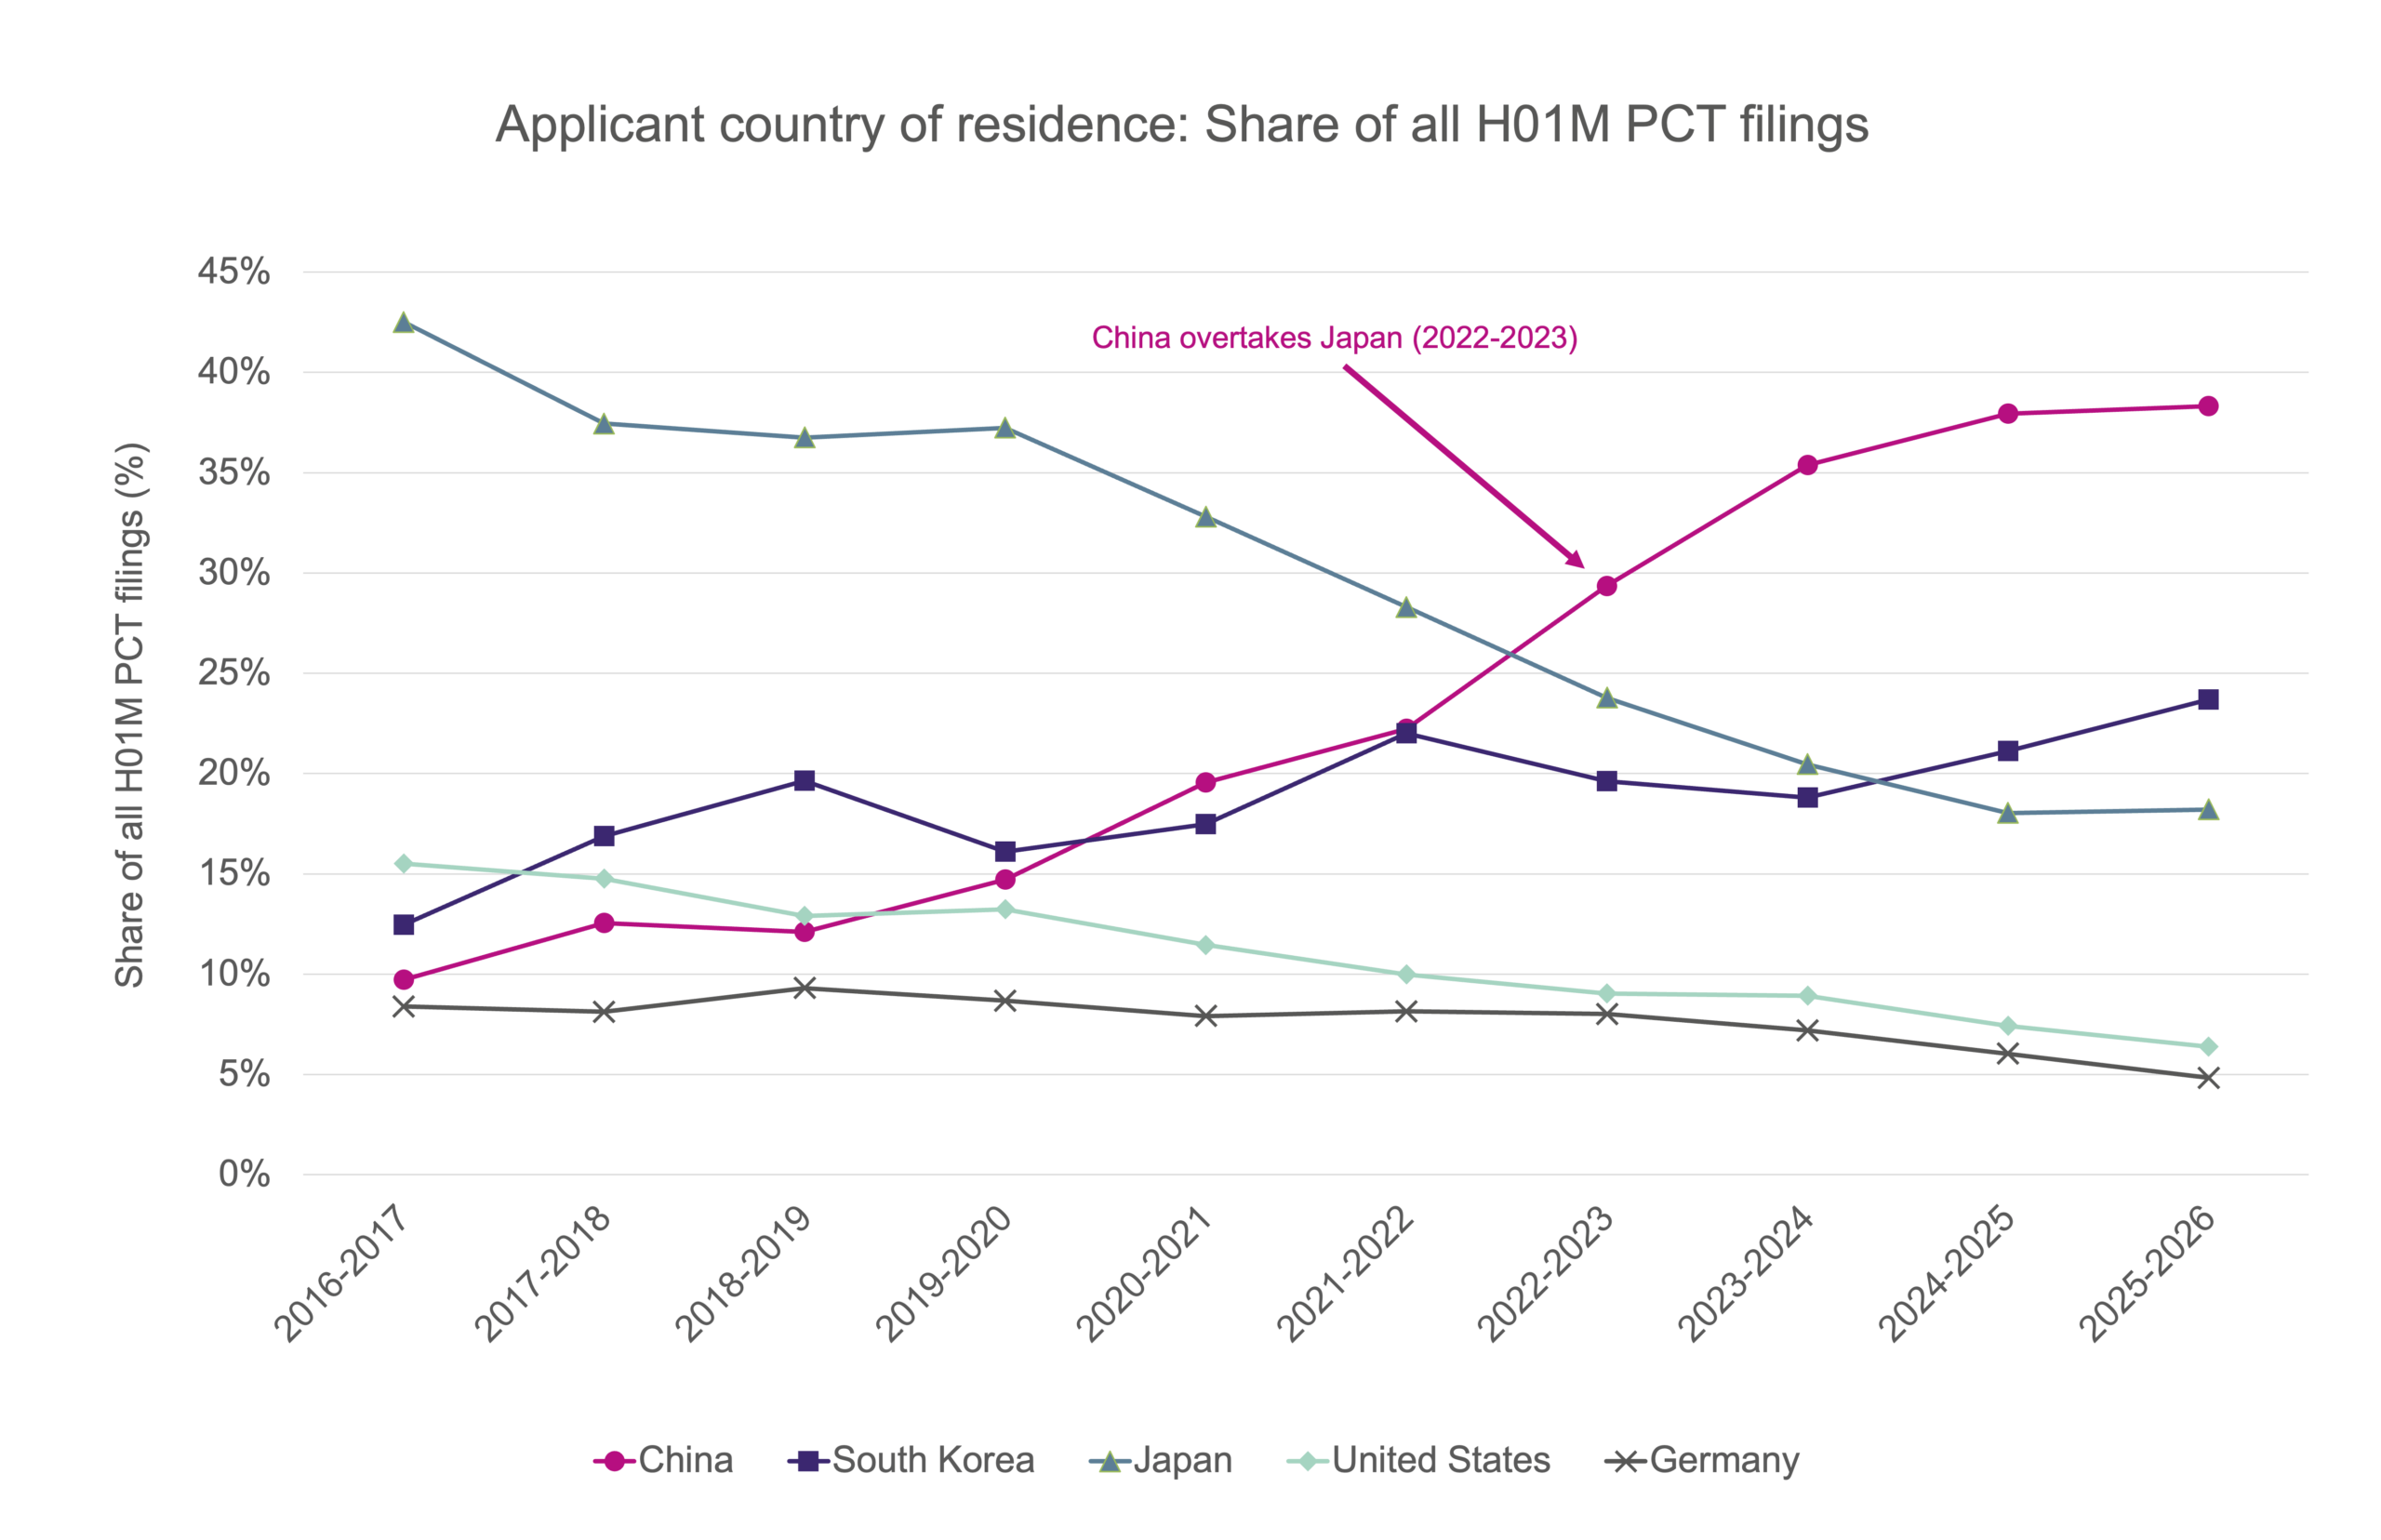
On this measure, China’s share of all H01M PCT filings rose from 9.7% in 2016-2017 to 38.3% in 2025-2026 – an absolute compound annual growth rate of about 34%, comfortably the fastest of any country. A clean milestone also emerges: China overtook Japan as the single largest country of origin in 2022-2023 and has led outright ever since, with South Korea passing Japan for second place in 2024-2025 and pulling clear thereafter.
| Country of residence | 2016-2017 share | 2025-2026 share | Absolute CAGR |
|---|---|---|---|
| China | 9.7% | 38.3% | +33.5% |
| South Korea | 12.5% | 23.7% | +23.1% |
| Japan | 42.5% | 18.2% | +4.3% |
| United States | 15.5% | 6.4% | +3.9% |
| Germany | 8.4% | 4.8% | +7.8% |
Table 3 – Country-of-residence share of all H01M PCT filings, first and last periods, with absolute CAGR.
China dominates the elite tier more than the broad field
Setting the two China measures side by side reveals a subtler point. China holds around 50% of the top-20 assignees but around 38% of all filings. The gap is a direct measure of concentration at the very top: China’s dominance is even more pronounced among the largest filers – CATL, BYD, EVE and their peers – than across the long tail of smaller applicants.
The United States: A striking decline
The country data surfaces a finding the assignee tables understated. The United States, second only to Japan a decade ago, has seen its share collapse from 15.5% to just 6.4%. Its filings have also fallen in absolute terms over the last three years – as have those of Germany; only China, Korea and Japan grew. But the United States stands out for the scale of its relative decline: for an innovation economy of its size, it is now conspicuously under-represented in battery PCT activity.
The leaders: A lead that changed hands
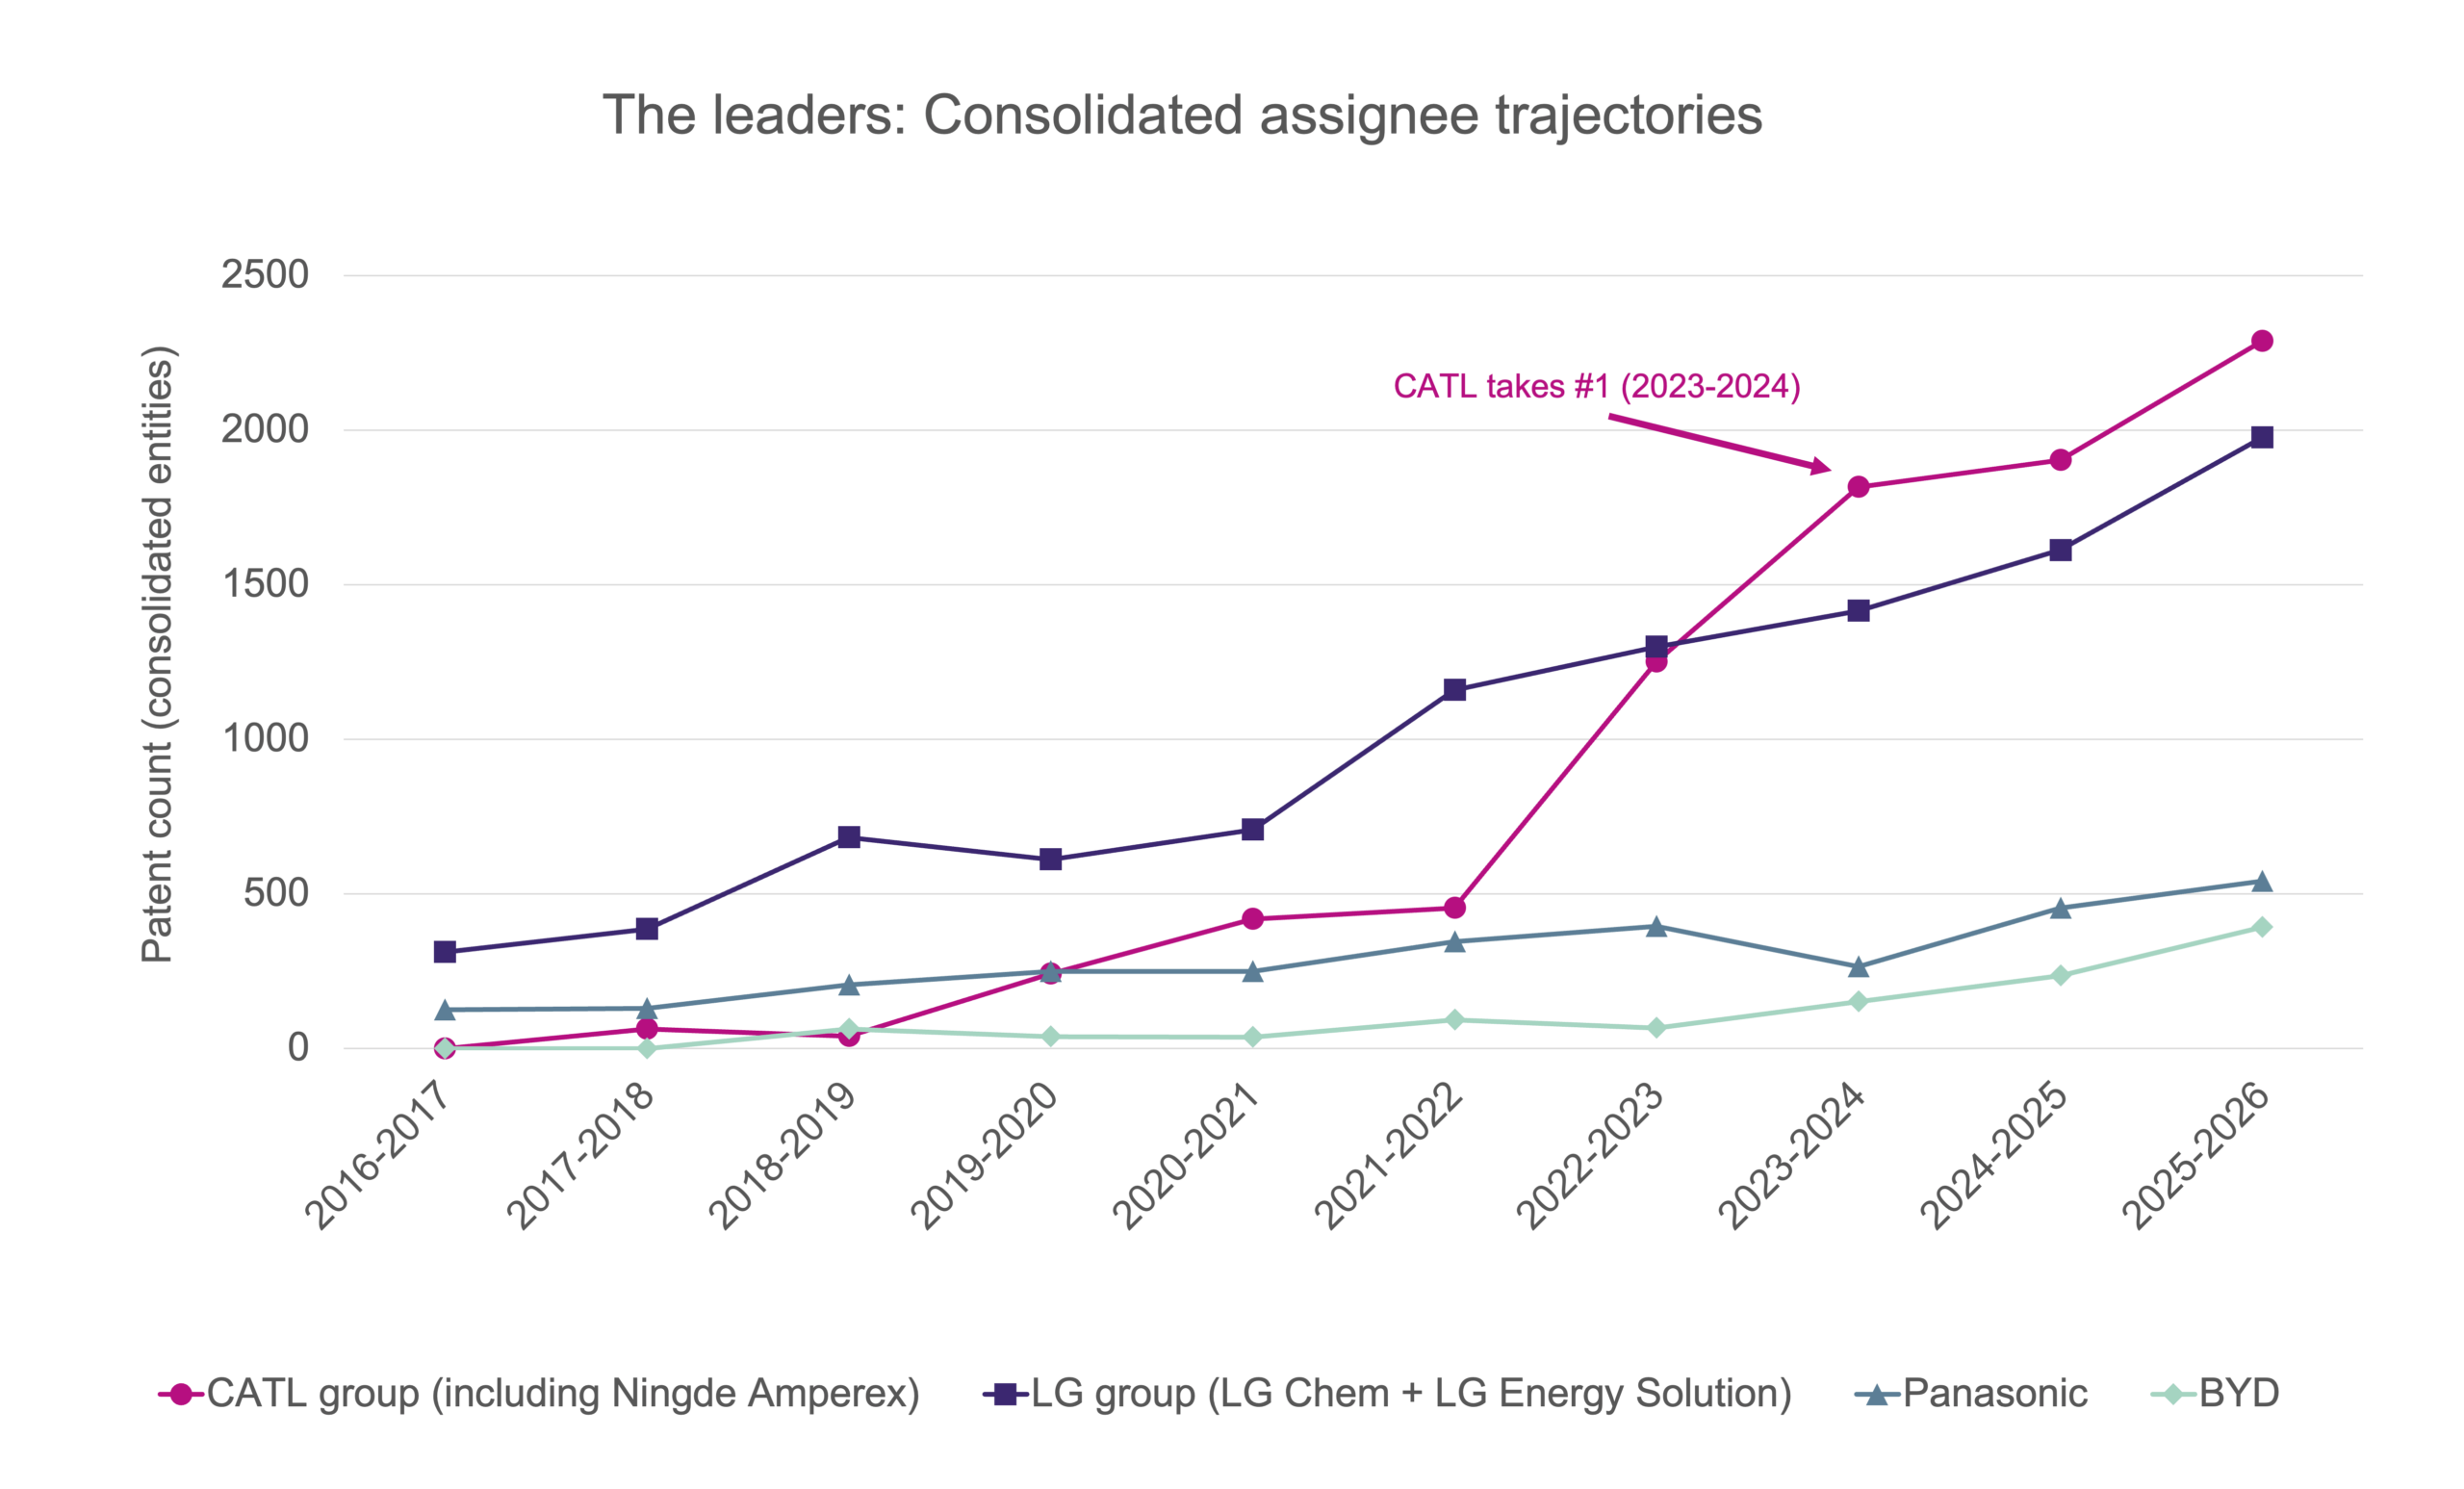
Consolidating affiliated filers (e.g. LG Chem with LG Energy Solution; CATL with Ningde Amperex) shows the number-one position was a genuine race. The LG group led the ranking until 2022-23, before CATL seized first place in 2023-2024 and extended its lead thereafter. CATL’s own arc – absent from the table a decade ago, second by 2020-21, and clear leader today – is the single most dramatic story in the dataset.
Breadth, not just depth
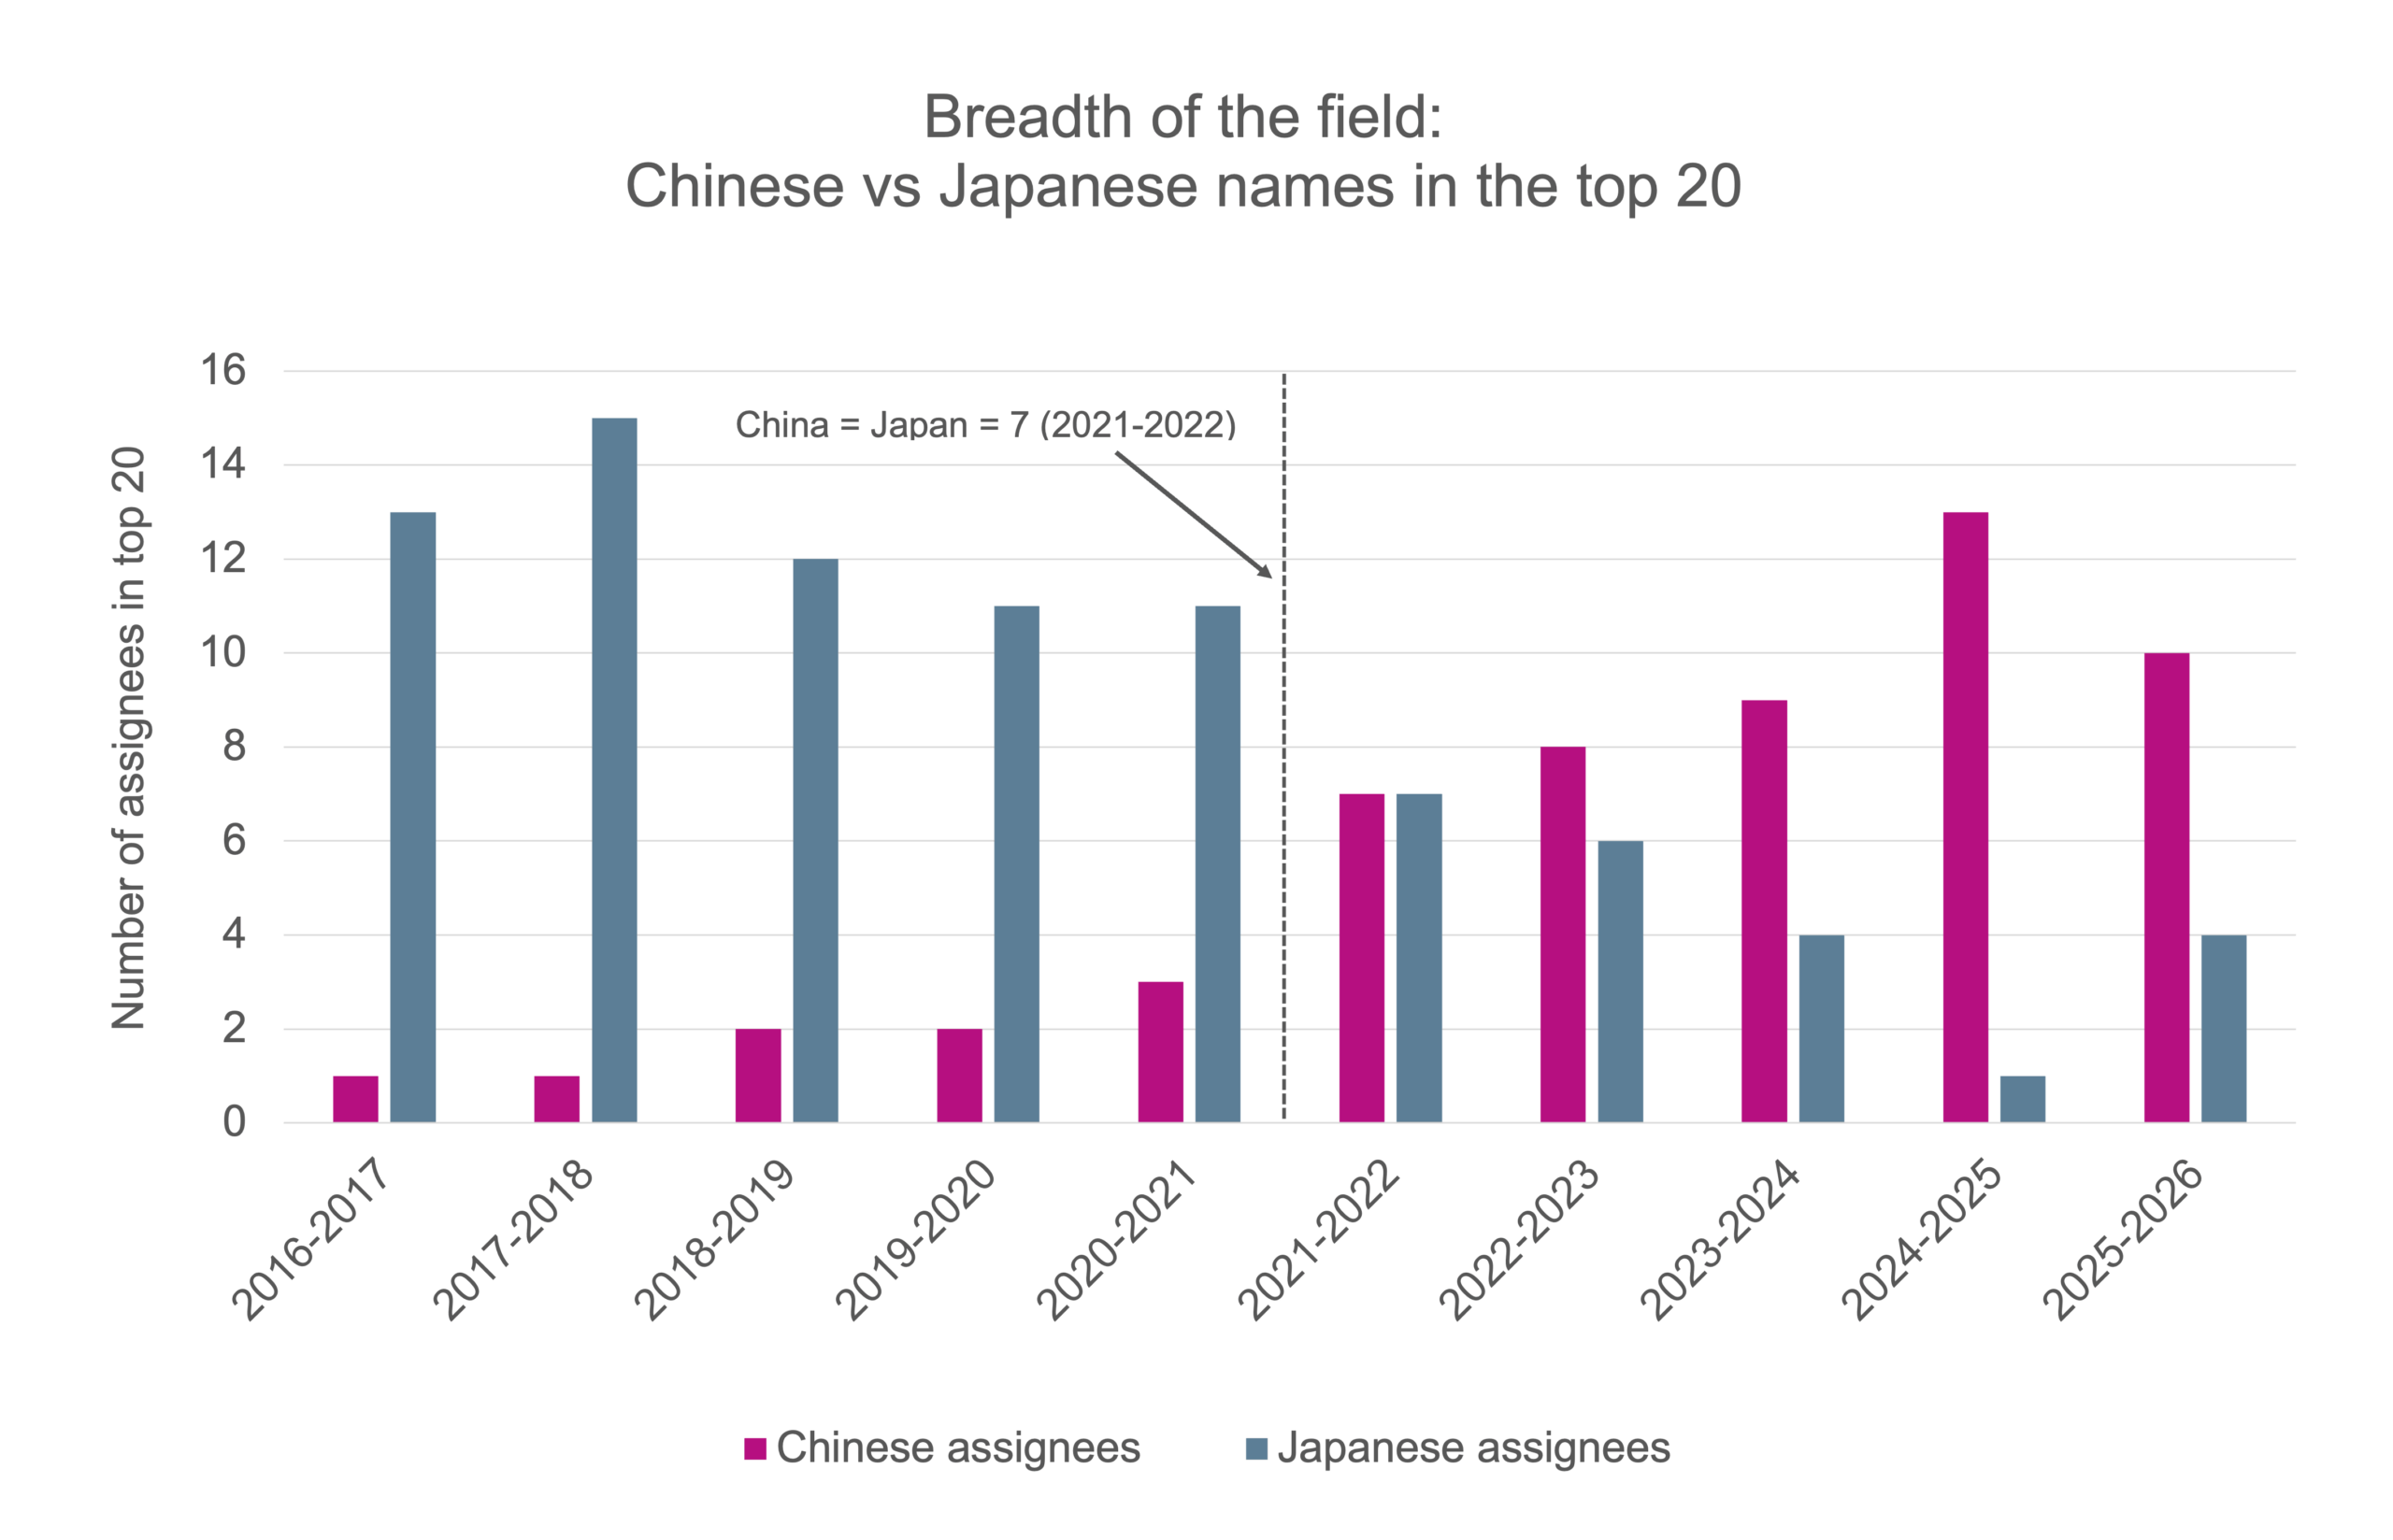
It is not only the top names that changed. The number of Chinese assignees in the top 20 rose from one lone pioneer for much of the 2010s to seven by 2021-2022 (the crossover year, when China and Japan drew level) and to thirteen at its 2024-2025 peak, when Japan was reduced to a single entry. A whole cohort of Chinese specialists arrived essentially post-2021: alongside CATL and BYD came EVE Energy, Sunwoda, Xiamen Hithium, SVOLT and CALB.
The incumbents: Diminished, not displaced
Although new Chinese applicants increasingly dominate this space, the established players have not vanished. In absolute terms Japan’s total output rose over the decade (from around 1,750 to 2,550) even as its share of all filings more than halved, from 42.5% to 18.2%. Panasonic has proved the most resilient individual filer, holding third place. Robert Bosch, Nissan, GS Yuasa and the German OEMs BMW and Audi remain a persistent minority presence, with Germany a stable mid-single-digit bloc throughout. The story is one of dilution, not disappearance.
What it means
- Battery innovation is booming but maturing. Growth of ~15% a year over the decade has recently cooled to single digits.
- China now sets the pace – and is still rising. From under 10% to 38% of all filings (and ~50% of the top 20), China’s rise is the structural story of the decade, with its filings still growing in the latest year.
- Dominance is greatest at the top. China’s share of the elite top-20 (~50%) outstrips its share of the whole field (~38%); CATL plus LG Energy Solution alone account for roughly 27% of all H01M PCT publications.
- The United States is a notable decliner. US-origin share fell from 15.5% to 6.4% – the steepest relative fall among the majors, though several Western origins also declined in absolute terms.
In Part 2 of this series, we turn to the race to recycle the world’s batteries — who the top players are, and where they are patenting.
Methodology note. Figures are PCT applications published in classification H01M, counted in August-to-August periods (2025-2026 is a full year to 1 August 2026) and de-duplicated to one record per international application. H01M covers batteries broadly – primary and secondary cells and fuel cells – so the corpus spans battery technologies generally. Country of residence is determined from the current-assignee address across the complete population of filings. Assignee ranks and top-20 shares use each year’s top-20 current assignees; affiliated entities are consolidated where noted (LG Chem/LG Energy Solution; CATL/Ningde Amperex). Published-PCT counts lag filing by roughly 18 months.